Can we find statistical evidence for pitchers having variable stuff and command between outings? Or are the differences we see merely the effect of small sample sizes and lucky results on batted balls?
Motivation
When watching a game, we often hear about how well a pitcher's stuff is working that day, or how he can't command his pitches. In this post I'll look at whether stuff and command, as measured by PitchingBot, change by significant amounts between appearances.
A single appearance by a pitcher is subject to a tremendous amount of variation, a guy could throw a no-hitter one day, and on another, be chased out of the game in the fourth inning after giving up 7 earned runs. This variance is due to the relative infrequency of run scoring events, along with the unpredictability of batted balls. We can imagine the quality of a pitcher's outing as the result of a series of dice rolls, each swing decision and batted ball location being subject to random chance. Throwing great pitches and having a solid game plan can load these dice in the pitcher's favor, but the element of chance cannot be removed completely. I'm going to investigate whether pitchers have noticeable changes in their pitch quality between appearances, or if they mostly throw with the same quality each outing and the results are purely the consequence of other effects such as luck or the hitter quality.
I should note that I am not advocating for ignoring the results a pitcher achieves. My models are flawed and there is a lot of scope for scenarios where a pitcher gets bad results which are not the result of bad luck or poor pitch quality. For example if a pitcher tips his pitches, is being too predictable with his locations, or throws to a hitter's hot zone, then these are cases which PitchingBot cannot pick up.
However, when it comes to evaluating a pitcher's performance based on factors he can control, we should not be changing that evaluation based on the results of bloop singles, inconsistent umpire strike zones, and hitters guessing correctly. I believe that measuring whether pitch quality is consistent between outings can tell us if a pitcher who is dealing is actually doing anything different to normal, or whether the baseball gods are simply favoring him on that day.
Using predictive statistics instead of a results based method may help to cut through the noise and more reliably find occasions when a pitcher was performing well above or below his normal quality. This could be useful for finding causal links in explaining why the pitcher performed so well/badly, allowing for better game preparation going forward.
Method
We can imagine each pitcher as having an underlying distribution of pitch quality, in both stuff and command. Each time they throw a pitch they take a random sample from that distribution. What I will try to measure is whether this underlying distribution changes between outings.
 |
| The pitches thrown in an outing (blue) are sampled from an unknown underlying distribution of pitch quality (black) |
We can imagine that a pitcher who is confident, healthy, and woke up on the right side of bed might be throwing pitches sampled from a much better distribution than the same pitcher if he'd hit the sauce last night and had niggling shoulder discomfort.
 |
| If a pitcher throws pitches from different underlying distributions (Blue and red curves) on different appearances, can we measure this by comparing the observed pitches (Blue and red histograms)? |
We cannot know or measure for certain the underlying distribution of pitch quality, we can only observe the pitches that end up being thrown which gives us an estimate for the distribution. If we can say with confidence that a pitcher was throwing from a different underlying distribution then he's effectively a different quality of pitcher on that day.
To do this I'll be using something called a Kolmogorov-Smirnov test or KS test. This is a statistical test to compare whether two samples are taken from the same distribution or not. The details aren't important here, but the key is that this test returns a P-value, a probability that the samples are from the same distribution. If the P-value is very low, then this implies that there is a significant change in pitch quality in that outing.
I will be testing the distributions of the stuff and command run values generated by PitchingBot. I'm using these for a few reasons:
- I think they're cool
- They're generated for every pitch which gives me a large sample to work with
- They are generated on a continuous distribution
- They predict how changes in stuff and command affect the pitcher's results
It would be possible to perform the same tests using statistics such as pitch velocity or strike percentage however these may not be as predictive of the quality of a pitcher's outing.
I used the 2020 season as the source for my data. I filtered to only include pitchers with at least 10 outings in the season. For each outing I performed a KS test between the pitches in that outing, and the rest of the pitches for that pitcher in 2020. This generated a P-value for both the stuff quality and the command quality in that outing. The lower the P-value, the more abnormal the outing was.
Results - Command
Before we look at the results of the KS tests, let's see how the distribution of pitch command varies between pitchers. Below I have shown the command run values for pitchers with some of the best and worst command, as measured in the 2020 season. Negative values are good as they mean a lower predicted number of runs scored. Richard Bleier had excellent command in the 2020 season, as shown by the large red peak on the left, meanwhile Edwin Diaz threw a lot more pitches with bad command ratings as seen by the larger area under the blue curve on the right. The differences between these two extremes are not very large in the distributions, implying that changes in PitchingBot's measurement of command may not be detectable in single outings.

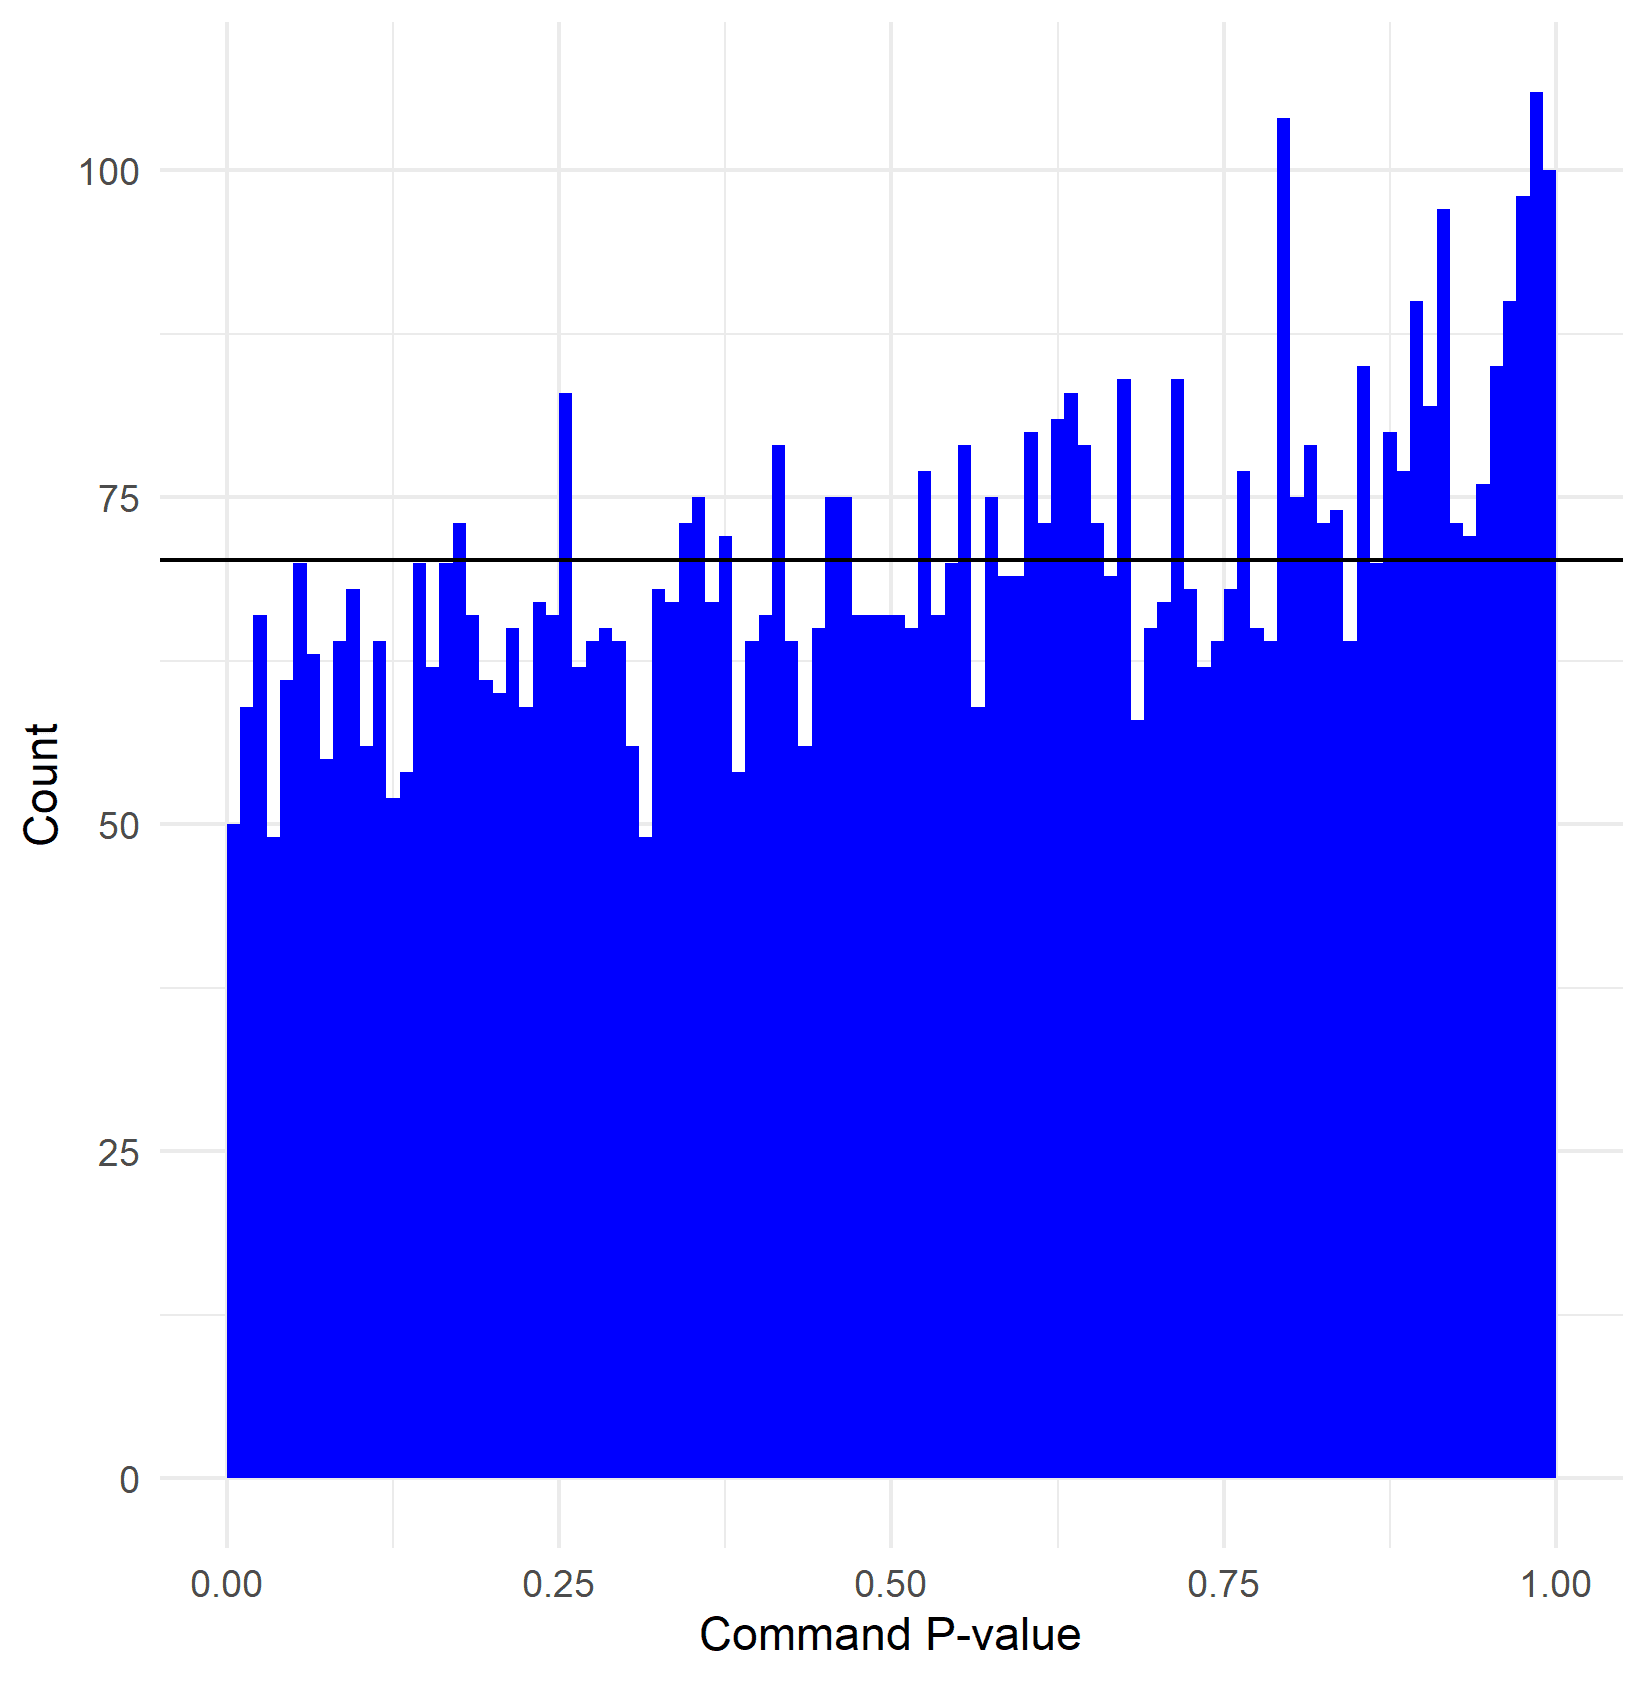
The distribution of P-values for command is shown below. If there were no significant changes in the underlying command distribution between appearances, I would expect the P-values to be distributed evenly between 0 and 1, shown by the black horizontal line. Here we can see that there is not a peak at low P-values meaning that we cannot say that pitchers have meaningfully different command in some appearances compared to others.
There is one exceptional appearance when it comes to pitch command. Josh Hader's outing on the 29th of August against Pittsburgh. He walked 5 batters and only made one out via a strikeout. The chance of his underlying command being unchanged compared to normal during this outing is less than one in a million.
We can look more closely at this appearance and see why it has such a high P-value. Below is a graph showing the command distributions for all of Hader's 2020 outings. The solid black line is the command distribution for the 29th of August and the dashed black line is the average of all his outings excluding the one we are considering. He threw a total of 32 pitches, only 9 of which were strikes and only 6 were in the zone. This large sample, combined with the clear difference to his usual command, means that we can say with confidence that there was something very different about Hader that day and he wasn't just having bad luck.

Apart from this example, there are no other pitcher appearances with such a low command P-value. This isn't to say that pitchers never have clearly wayward command compared to normal, watching a game it is possible to tell when a pitcher is drastically missing his spots. PitchingBot only looks at the run value of where a pitch is placed, therefore it will not see any difference between an effective pitcher and an effectively wild pitcher.
Results - Stuff
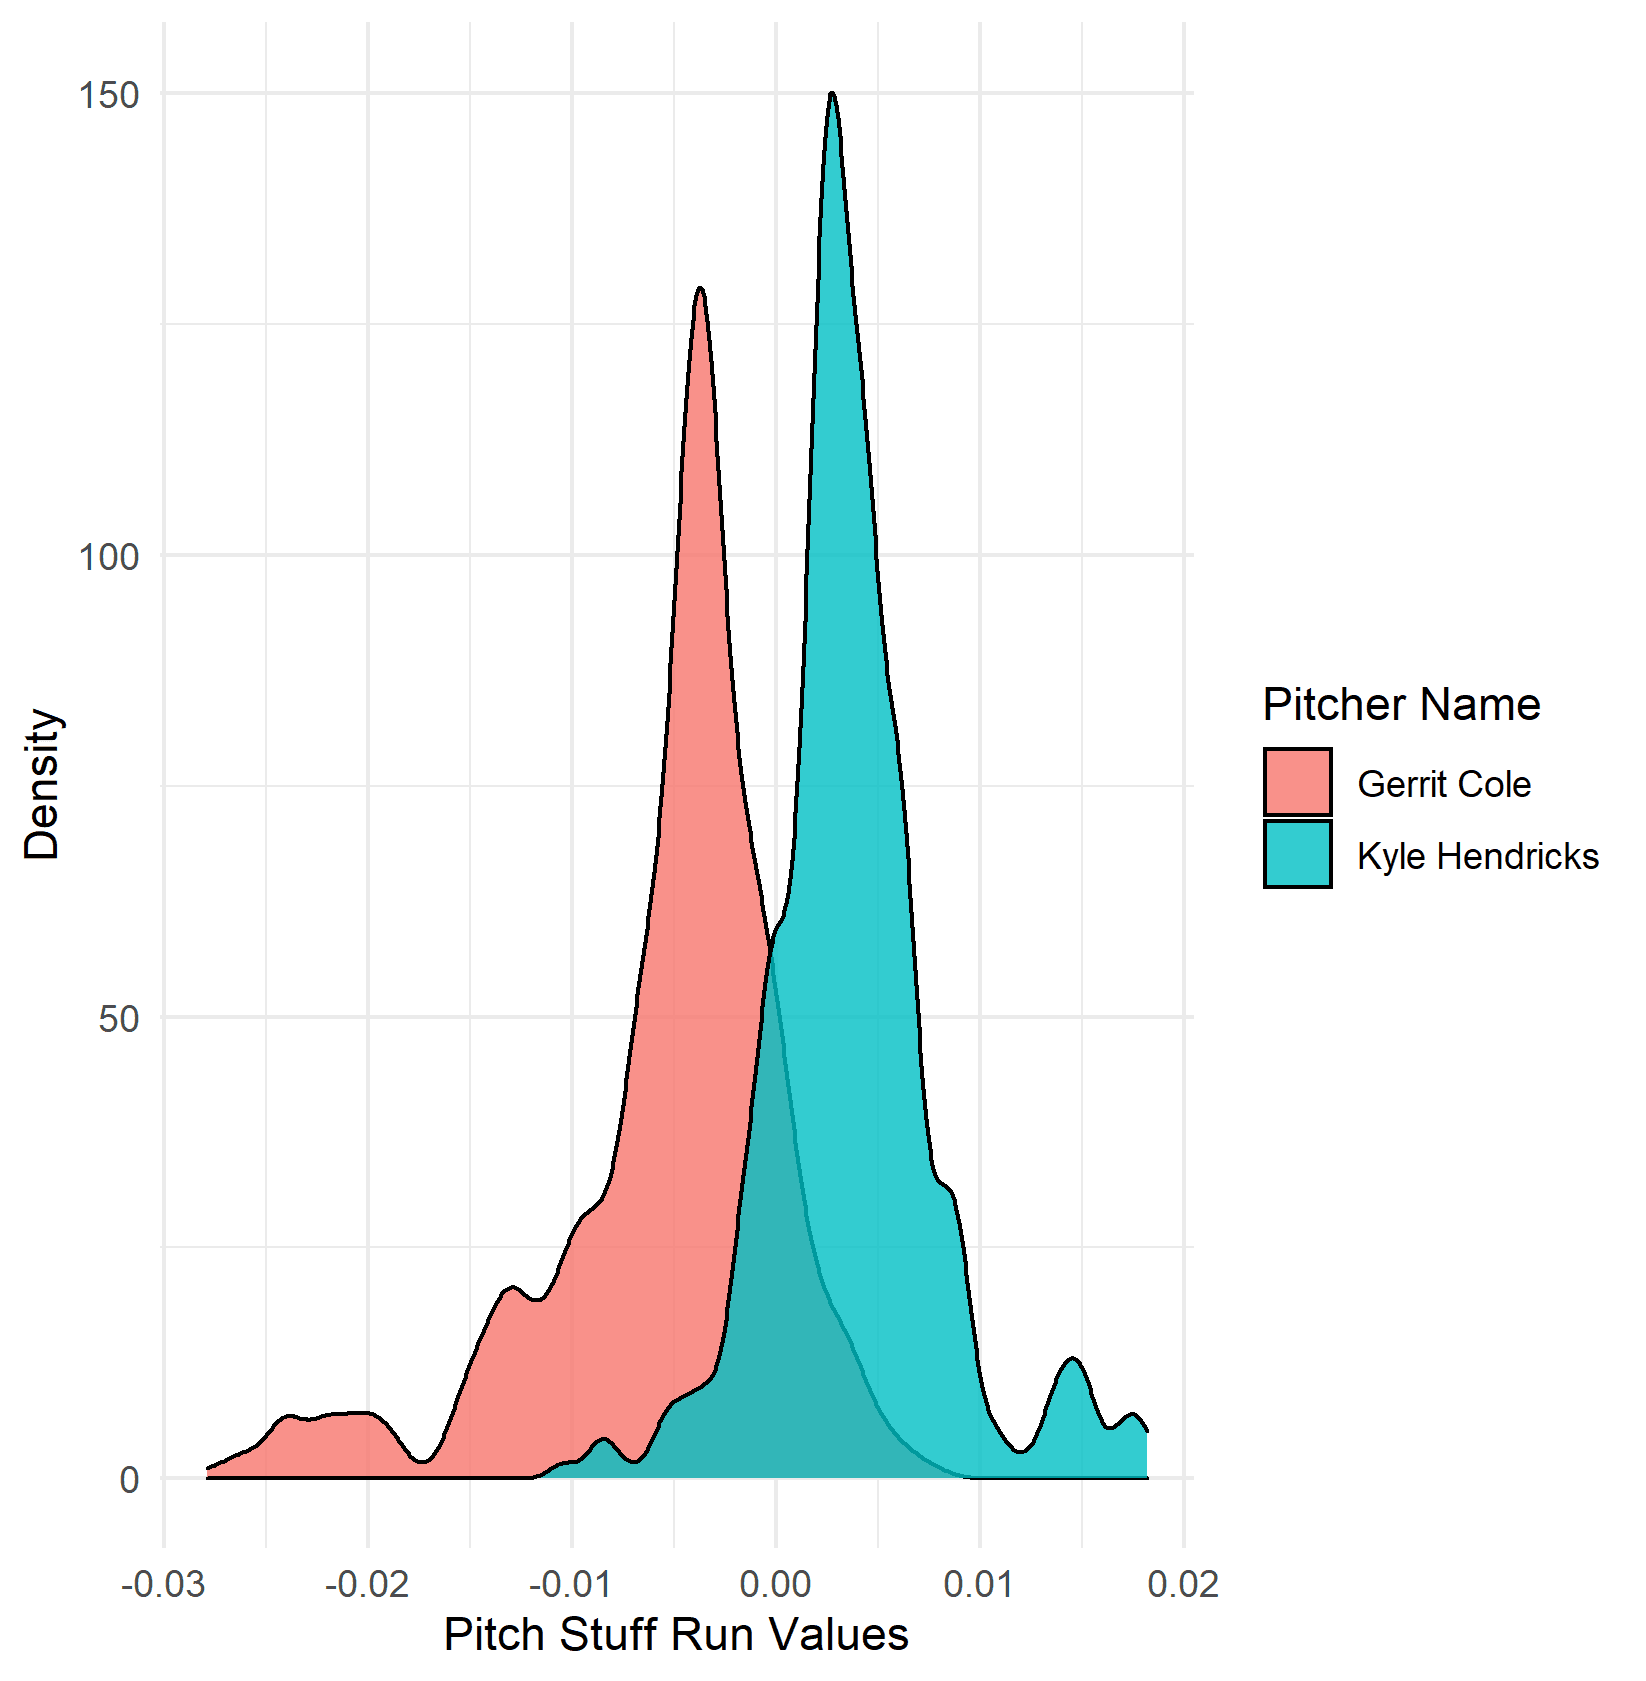
Pitcher stuff shows much greater variation than command and it's easy to see why. Kyle Hendricks will never throw a 99Mph heater and Gerrit Cole will never throw a fastball below 90Mph (at least not anytime soon). There are physical limitations to stuff which are not seen with command, anyone could happen to throw a few pitches in perfect spots, but to throw even one pitch with great stuff is very difficult. PitchingBot's stuff run values show clear differences between pitchers with good and bad stuff as seen below.

The Coors Effect?
The most significant stuff value change was experienced by Kyle Gibson of the Rangers when playing the Rockies at Coors Field on the 15th of August. His stuff on that day was significantly worse than normal (black solid line), when compared to the reasonably stable distribution shown in his other starts (dashed line). When I looked at the data for this start I couldn't see any change in his velocity or spin rate, however the movement on his pitches was down significantly.

This is an example of the Coors Effect, the lower air density reduces the air resistance on the ball which reduces pitch movement. I was surprised to see this show up so strongly in my data. In fact when we filter the data to only include visiting pitchers at Coors, as shown below, 38% of them had significant stuff changes (P<0.05). Filtering again to only take visiting pitchers who threw at least 30 pitches and 64% had measurably altered stuff values.


Pitch Mix
Lucas Giolito had a significantly different stuff profile for his playoff start against the A's. PitchingBot thought he was throwing much better pitches than usual. I believe this is due to him using a different pitch mix in this start. Giolito is a heavy fastball/changeup pitcher, with a slider as his third pitch. His changeup baffles PitchingBot as much as it baffles opposing batters, and PitchingBot doesn't predict its stuff to generate good results. On the start in question, Giolito threw his slider more often at the expense of his changeup which altered his stuff rating sufficiently for the KS test to notice. Perhaps this was part of the game plan, or maybe he had a better feel for his slider on the day in question. Whatever the reason, this Giolito was different to normal, and it paid off with a dominant outing allowing only two hits in seven innings pitched.

Other changes in stuff
Glasnow had a bad outing at Boston on the 13th of August. He gave up 8 hits and 5 earned runs despite striking out 8 in 4 innings. PitchingBot usually loves Glasnow's stuff, rating it as some of the best in the league for a starting pitcher. On this occasion his stuff was above average but worse than his usual elite performance. His four-seam fastball had a few inches less rise than normal, which perhaps contributed to worse stuff ratings and a worse performance.

Conclusions
In this post I've explored how pitcher's stuff and command can vary between outings, and whether we can find statistically significant changes between the same pitcher on different days.
Using this method, it is not possible to measure whether a pitcher's command is better or worse on a given day because the distribution in command values is so similar for pitchers with both good and bad command. The only exception was an outing by Josh Hader which exhibited probably the worst command of the season.
We can learn more about pitcher variance through the quality of their stuff. Whether it is by mixing their pitches differently, playing at Coors, or not generating as much movement as usual, differences in stuff show up much more strongly in the KS tests I have performed.
However for the majority of pitcher outings, whether they're dealing, getting shelled, or having a pretty normal day, their pitching is consistent with all their other appearances.*
*According to PitchingBot
I don’t understand why Hader’s performance is 1 in a million.
ReplyDeleteHader throws 47% off his pitches in the strike zone.*
*https://baseballsavant.mlb.com/player-scroll?player_id=623352#pitchTypes
In his 5-walk outing, he threw 6 balls in the strike zone out of 32 pitches.
According to a binomial calculator, the odds of Hader throwing less than 7 strikes out of 32 pitches is .087%.
This is 1 in 1,150. Rare, but not 1 in a million.
Hey, you're correct, if I was using zone rating as a proxy for pitcher command then this wouldn't be such a rare event.
DeleteHowever, I'm using my own modelled command run values. It takes a while to explain what these are but essentially they spit out a number based on whether the location of the pitch is good or bad based on pitch type, ball-strike count etc. The worse the location the more positive the number.
When Hader normally throws outside the zone, he is ahead in the count so the pitch location isn't too bad and could even be good if it encourages a batter to chase! However in the 5-walk outing he threw outside the count in a lot of 3-ball counts. My model hates walks so these pitches get really bad run values. The KS-test thought these run values were super unlikely to happen based on his usual performance, hence the very low P-value.