This is a post to describe various updates to my pitch quality models.
For the post describing the initial models see here.For a link to the app where you can explore the model ratings click here.


A new input variable which has velocity and movement differences for each pitch from the fastball average on an appearance basis has fixed these differences.


Why Change?
There have been many developments in the pitch evaluation model public space since I initially created my models. Max Bay and Eno Sarris' Pitching+, and others have entered the conversation about how we rate good pitches.
These developments have helped me to realise some of the shortcomings of my models and have given me ideas on how to improve their accuracy.
What's changed?
These are the main updates which I have added to my models:
- Included fastball velocity and movement to the input variables
- More ball in play predictions, including exit velocity in addition to batted ball type. This allows me to estimate HR% for pitchers too
- Each prediction model now has more finely tuned hyperparameters than before
- Stuff models now only predict events which occur on swings, this is because otherwise I have to infer swing% and zone% from stuff alone.
- On the app display I've added percentile sliders for various rate statistics, reminiscent of those on the BaseballSavant website
If you aren't interested in all the details then you can stop reading here, otherwise the following sections will give more information on each change.
Fastball Quality Input Variables
My previous version of the pitch evaluation models treated every pitch individually, this meant that there was no way for the model to know who was throwing the pitch however this removes important context which can improve the models significantly.
If a pitcher has a good fastball then it improves their other pitches accordingly. This is because the better the fastball is, the less time that hitters have to react to breaking balls and offspeed pitches. The graphs below show this effect in my old models. They were underrating the non-fastball pitches of pitchers with good fastballs.
Here is a graph which shows the importance of the relationship between a fastball and an offspeed pitch. Changeup whiff rate is heavily dependent on both the vertical movement difference and the velocity difference to a pitcher's fastball.
Ball in Play Predictions
My old models predicted whether a ball in play would be a groundball, line drive, or flyball, but there's clearly a large difference between a weakly hit ball and a hard hit ball. Weakly hit flyballs are awful for the hitter, while hard hit flyballs are the best batted balls by run value. Pitchers only have limited control over exit velocity, it is more affected by a hitter's power. However pitchers can have some effect which is visible over a large sample size. I aimed to include predictions of how hard a ball would be hit in order to improve my evaluation of balls in play.
I modified my ball in play prediction model to assign probabilities to 15 different events. These are the three main batted ball types: groundball, line drive and flyball, along with exit velocity in 5 bins with edges at: 90mph, 95mph, 100mph, 105mph. The frequency and run value of these batted ball types are shown below, the colour of the dots represents the run value and the size represents the relative frequency.
Hard-hit flyballs are most valuable but also the rarest batted ball type. These exit velocity bins are rather arbitrary and if I find a much more useful way to bin them then I'll switch to using that instead.
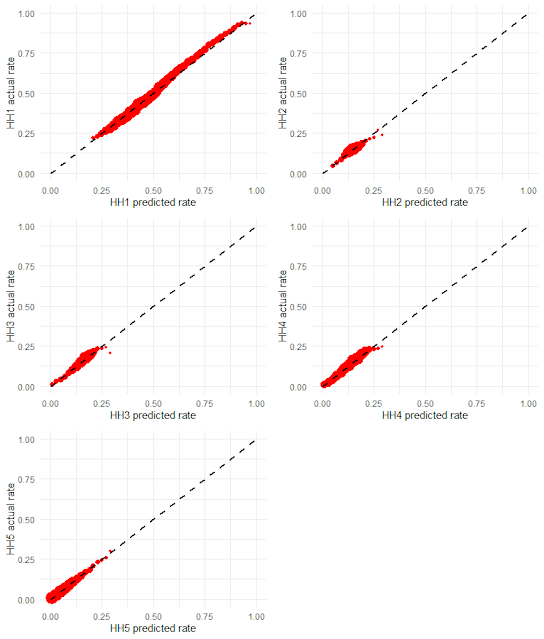
The graphs below show that the probabilities produced by the models are representative of the actual probability of a particular batted ball event happening. HH1 through HH5 in the second set of graphs represent my exit velocity bins from low to high.
Percentile Sliders
A useful feature of the website BaseballSavant is the box at the top-right of every player page with a set of sliders, these quickly show the relative ability of the chosen player in a variety of stats. I decided to add my own version of these sliders to show how players perform in my models relative to other players.
All stats should be reasonably self explanatory, higher is always better in these ranks. For each stat a simple google search of the stat without the preceding "x" should give the definition if you are unsure.
It is important to note that these sliders show the percentile rank of a pitcher in each stat, not the value of the stat itself!
xHardContact% is defined as the predicted fraction of batted balls hit harder than 95 mph.
xHR% is the predicted home run rate, found by using the predicted rates of the different types of balls in play defined above.
As an example here's Corbin Burnes, who's great at everything!
I would like to generate your statistics myself using R and XGBoost, how did you code it?
ReplyDeleteI can't share the code but I'm happy to give you general advice on building similar models depending on your level of programming experience. Feel free to email me at: camerongrove96 [at] gmail.com
Deletecould you add expected flyball%? (xFB%)
ReplyDeleteI already have xFB% under the hood, it's just 1-xGB%.
DeleteOn the app you can find xGB% for a pitcher by clicking the "Click to see more graphs button" and choosing the statistic xGB% in the "Expected Stats and Comparison to Actual Performance" graph.
Is this similar to the blob app that driveline baseball uses? Very nifty!
ReplyDeleteI hadn't heard of that when I created my models, but yes it's a similar idea.
Delete