Here I show how relief pitchers get significantly worse results when hitters see them on multiple occasions in a short time period.
*Note - There are selection biases in the graphs below that can cause pitcher overperformance in the initial matchup for several samples. I've added an appendix with graphs that exclude this selection bias to show that the effects are still real (albeit with a smaller magnitude than would be suggested by the original analysis). Find the appendix at the end of the original post.
Introduction
The effects of familiarity on hitter-pitcher matchups in the postseason are often discussed on broadcasts and in articles, however I haven't seen much research on the subject. This led me to investigate the question myself with surprising results.
I tweeted the results of a short investigation a couple of weeks ago [1][2], but here I am presenting some more detailed work, across more statistics than just wOBA and run value.
I took data from the 2010-2021 seasons, filtered out all the starting pitchers, and in cases where relievers pitched over one time through the order I only selected their first matchup with a particular batter in a game. This allowed me to group results by the number of times a particular hitter-pitcher matchup occurred to see how results change the second and third time that two players face up.
Postseason Results
Playoff series are longer than regular season series and teams prepare more intensely for them since the stakes are much higher. This means that hitters will get more looks at relief pitchers and any effects due to familiarity should be more clear than in the regular season.
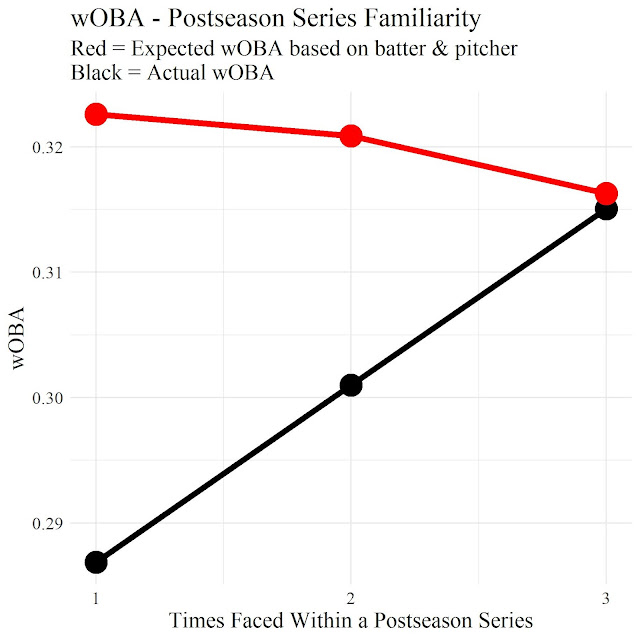
The graph above shows how wOBA changes across different numbers of matchups in the postseason. Results are shown with error bars representing the expected variation in the statistic based on the sample size available. I want to make clear the expected level of noise on these statistics given that postseason statistics only have a limited sample size.
There were 6853 batter-pitcher matchups which occurred once in a postseason (red dot), 2230 which occurred twice (green dots), and 614 which happened three times in the same series (blue dots).
We can see clearly that wOBA rises on each subsequent match-up, there is a difference of around 100 points between the first and last matchups for pitchers who faced the same batter three times.
It is also noticeable that matchups which happen more often have a lower wOBA on the first plate appearance, could it be that this is simply a selection bias and the decrease in performance is regression to the mean?
I don't think so, a lot of the pitchers who face the same hitter are closers who will be expected to have better than average results, the top pitchers in terms of the number of batters faced at least three times in the same series are: Kenley Jansen, Cody Allen, Kelvin Herrera, Pedro Baez, Andrew Miller, and Aroldis Chapman. In addition, in matchups which are repeated at least three times in the same series pitchers had the platoon advantage two thirds of the time, compared to 55% of the time on average. Therefore the batter-pitcher matchups which occur three times should be expected to have lower wOBA than matchups that only occur once or twice.
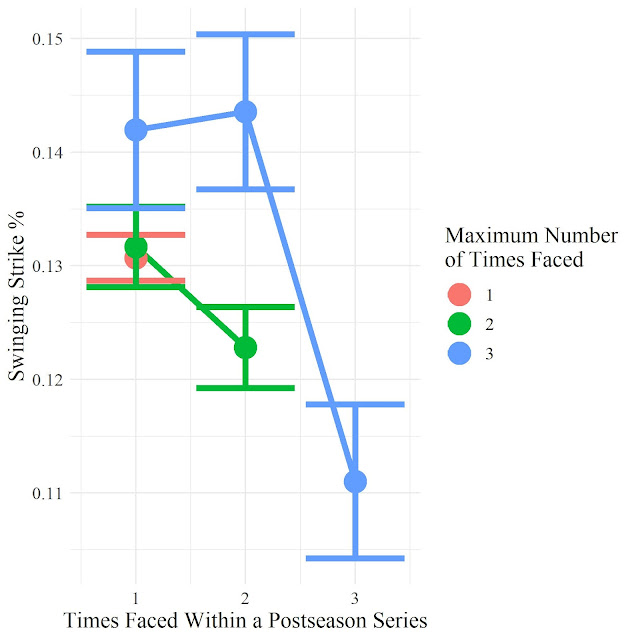
Below are graphs showing how other statistics change as the number of matchups increases. These won't be discussed in detail but can provide further context on how results are expected to change.
Regular Season Results
The same process can be repeated within regular season series, these are shorter so it is less likely for a relief pitcher to face the same hitter three times. However the overall sample size is much larger.
Within individual regular season series from 2010 onwards, There were 352275 batter-pitcher matchups which occurred once, 56252 which occurred twice, and 1450 which happened three times in the same series.
Again, repeated matchups were more likely to be same-handed, giving pitchers the platoon advantage, 68% same-handed matchups amongst those happening three times, compared to 52% for matchups which only happened once. Pitchers who were most commonly asked to face the same batter three times in a series were often closers, such as K-Rod, Sergio Romo, and Joakim Soria, but there were also LOOGYs such as Randy Choate appearing at the top of the list too.
Below are graphs showing the same statistics as before, again we can see worse results the more that a hitter sees a particular pitcher. There may be some selection bias here, as BABIP is suspiciously low on the first matchup in cases where a pitcher was used three times against the same hitter.
Implications for Strategy
It seems that relievers get worse results the more often the same hitter sees them, however this does not mean that repeat matchups should be avoided at all costs. In many cases, your closer with a familiarity penalty will still be a better option than a mop-up guy who the hitter hasn't seen before.
In the playoffs, with up to seven games per series, teams may need to be careful about over-exposing their best reliever to opposition hitters in situations which are not high leverage.
Conclusions
Relief pitchers tend to have fewer viable pitches to throw than starting pitchers, this means that they can't pitch multiple times through the order and are limited to shorter stints within games.
The three times through the order penalty has been well examined for starting pitchers, but it appears that a similar penalty may exist for relievers facing the same hitter multiple times across different games in a short space of time.
This penalty has been explored across multiple statistics in both regular season and postseason series. It appears to be a real effect, with significant implications for matchup based bullpen strategies.
*Appendix - Removing Selection Bias
Below are results where the populations are not split by maximum number of times faced in a series. The results are presented for the nth time faced in a series, regardless of the maximum number. This means that I am no longer controlling for the player quality in each sample, but the samples are not affected by the selection bias of prior performance.
In the results below, the point representing "1 time faced within a postseason series" represents all reliever/batter matchups that were the first occurrence in that series, whether the matchup occurred later in the series or not has no bearing.
I've added curves to show the expected performance based on the batter/pitcher matchup by using the odds ratio method from that year's regular season statistics for each player (short of producing my own projection system, I thought this was a reasonable approach). This should help to provide some context on how the pitcher/batter population changes would affect the results.
The results are mostly presented without comment, aside from where clarification is appropriate.
Postseason
There seems to be a miscalibration of postseason wOBA relative to my odds-ratio expectations above. Postseason wOBA is generally lower than the regular season which may explain some of the difference, that may be due to weather, preparation, rest etc. In any case, the black curve rises relative to the red curve by 30 points of wOBA, indicating that this is the level of the effect from more matchups in a postseason series.
Regular Season
wOBA only rises by 6 or 7 points in a regular season series between the first matchups and third matchups. However, selection effects on the pitcher population mean that a 10 point wOBA decrease would be expected. Therefore the overall effect is around 16 or 17 points of increase in wOBA, smaller than the postseason case.


This effect is pretty strong for starters, too, even in the regular season. When a starter faces the same opponent twice in a row, the batting team gains an advantage in the second start worth about .30 runs/9IP.
ReplyDeleteI looked at all times when a pitcher started against the team in consecutive starts within 10 days, from the 2015-2020 seasons. As a control, I looked at all pairs of starts where pitchers faced different opponents within 10 days. In each group, the pitchers allowed 4.43 runs/9IP. The control group saw that rise to 4.60 in the second start (we expect a rise due to selective sampling). The pitchers facing the same team twice saw it jump to 4.87 runs/9IP. The difference in the jump (.27 runs/9IP) I attribute to the familiarity effect.
If I look at K%, BB% and HR% directly, I can see the same effects. The control group sees a tiny bit of decay, but the repeaters see all three stats deteriorate noticeably in the second start. I would love to see your deeper dive at the same topic, or any feedback you have on what I did/observed.
This is a fascinating analysis that highlights how familiarity can impact pitcher performance.
ReplyDelete